 When I was high school head coach and it came to choose starters for our first scrimmage I always gave the same speech. As a coach I was not looking for the five best players to choose as a starting lineup, I was looking for the five players that played the best together. Now as a college assistant I don’t have to make that decision but I do have A LOT more data to help our head coach make his decision. Most all of the stat programs used by NCAA teams has a +/- or scoring differential report. For those not up on this the scoring differential report basically gives coaches the difference in score when a group of five players plays together. For example, when the game starts the score is obviously 0-0. If the score is 10-5 in our favor when our first substitution is made the the starting lineup would have a scoring differential of +5 at that point.
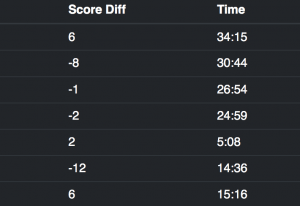
Being a basketball nerd and having failed to accurately track this as a high school coach I was enthralled with this report. As our season progressed I started to notice a pattern where when our starting point guard and backup point guard played together we almost always had a positive scoring differential. The two did not play together often but when they did the lineup always seemed to have a positive scoring differential. In an effort to isolate the two players data I had our developer whip up a pretty cool tool that takes the XML stats that our Sports Information Director sends to the NCAA and parses it down so lineups can be isolated to 2, 3, 4 or 5 players. Below is an example of a custom lineup with two players, three players and 4 players. I redacted the players real names because I am pretty sure Player 7 is going to be an attorney and I don’t want him coming after me 10 years down the road.
As you can see in the screen shot the lineups are broken down from 5 player lineups to 2, 3 and 4 player. In the particular game, when our starting point guard and backup point guard played together they had a positive scoring differential of 6 points. The four player group was -12 for the game and the three player groups had the same scoring differential of +1. This pattern was true in many games during the season. Using Lineup Analysis and scoring differentials coaches can get an idea of what groups play the best together and even use the data to explain to their team why certain players get more minutes. It could be used a powerful player development tool to get certain players to play the game “the right way”.
If any college coaches want to try out the tool and give some feedback reach out on Twitter,Facebook, Linkedin or our contact form and I will give a link and password.


I am interested in this tool. Please email me @ [email protected]/Twitter @coachjwatkins. Thank you!
I am interested in this program please email me at [email protected]
I would love to utilize this tool. If there is any more information you’re willing to share, please email me [email protected]
Coach, I would love to use this tool. Any more information you’d be willing to share would be awesome. Thanks, Jay
Yes, I am interested in this tool. Please email me @ [email protected]/Twitter @coachdooley. Thank you!
I would appreciate a look at this tool.
Thank you!
Me encantaría usar esta herramienta. Por favor, contacta conmigo [email protected] o en Twitter @danidiazg99