Using Expected Value to Define a “Good Shot”
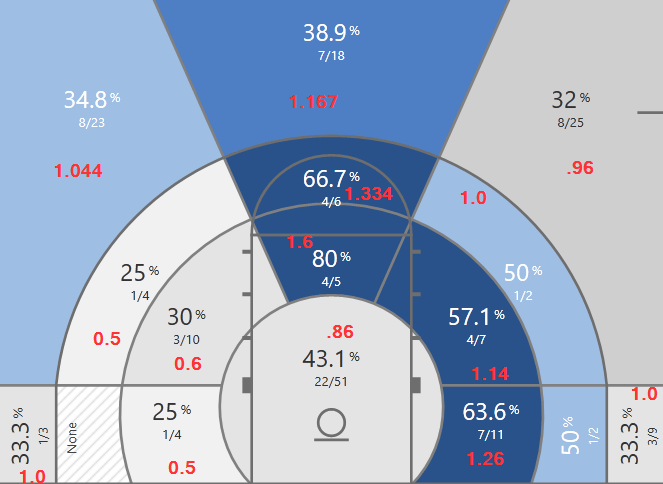
Undoubtedly over the course of a season you will hear a coach or broadcaster refer to a player taking a shot just inside the three point line as a bad shot. The common beef is that your are taking a long shot which presumably has a lower percentage chance of success without any added return on investment like a three pointer. In an effort to better help our players understand the value of a shot from different places on the floor I use something called the expected value of a shot. In the charts below you will see two percentages for each of the 16 defined areas on the court. The white percentage is the player’s actual shooting percentage to that point in the season . The red represents how many points can be “expected” if a player were to take a shot from that spot. The equation for calculating the expected value of a shot is tremendously simple.
2FG% x 2 OR 3FG% x 3 => For example, a player shooting 50% from the top of the key can expect a value of 1.5 points per three point attempt. (.50 x 3 = 1.5)
Here is a chart from one of our guards. You will see he shoots a lot of threes. We used this chart to show him the value in utilizing his pull up jumper around the free throw line where is expected value for a shot is very high. I used this chart that only has 16 areas for simplicty sake but in the 40 area chart you can see all 11 of the shots were close to the free throw line.
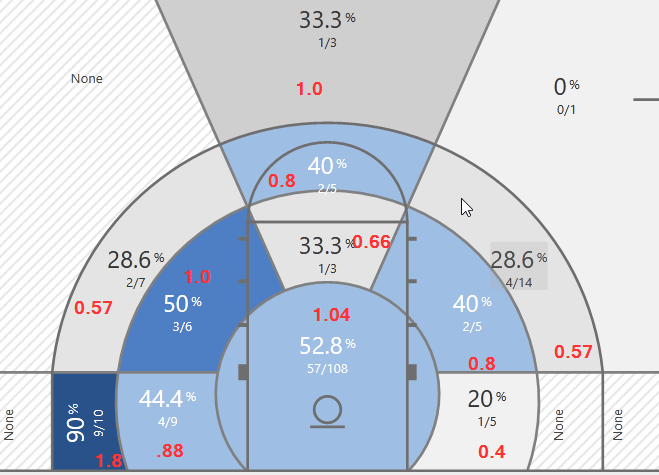
Here is another chart from one of our Bigs. We used this chart to try to get the particular post player to look for the ball in the post more and not settle for jumpers. Since focusing on his post game his expected value in the paint has increased to 1.4. For the record sometimes stats can make things more difficult. If you look in the corners you will see that our guy shot an asburdly high percentage in the right, deep long 2 corner. Naturally, he saw this as well and pointed out the high expected value and asked why he shouldn’t shoot more from there. After using Synergy to pull up shot charts of about 6 teams in our conference he finally backed down and conceded long 2’s from the corner are not great investments.


Very interesting. I assume you are using Synergy’s shot chart for your analysis. Does Synergy provide dimensions for its chart. The distance from the center of the cylinder for the 3-point line is 21’9″ as proscribed by the NCAA… but what distances is Synergy using for the other arcs and areas defined by the chart?
That’s a good question! They define Short as <17ft and Medium from 17ft - Three Point line. I think I will ask Synergy about the arcs. I'll let you know when I hear something.
Normally I define the shooting areas slightly different from what I see in this description, named from 0 to 9, as follows:
– 0: any high-proximity shot (lay-ups, dunks, or any shot within or near non-charge half-circle);
– 1: any shot within the paint zone other than described in 0.
– 2, 3, 4: two-point shots outside the paint zone, at the left, front (around FT line) or right respectively;
– 5, 6, 7, 8, 9: three-point shots at the left corner, left wing, front of the rim, right wing and right corner respectively.
Behind the half line / buzzer beaters: 6, 7 or 8.
I hope you like it.
Best regards
Matias Barmat
Game Analyst / Statistician
Buenos Aires, Argentina
This is great info, Matias! Thanks for sharing!
what service allows that charting to be done?
I used Synergy Sports